Overtones
Overtones is Resona’s visualization feature that displays all discovered connections across your reading history as an interactive graph. It sits at the top of the Digests page, making connections the hero of the experience.See the big picture. Overtones shows how your ideas connect over time — not just individual connections, but the cumulative pattern of resonance across your entire library.
What Makes Overtones Different
Unlike dense knowledge graphs that overwhelm you with every possible connection, Overtones shows only meaningful connections — the insights that matter.Curated, Not Comprehensive
Only meaningful connections appear — quality over quantity
Time as a Dimension
Watch your understanding evolve as connections accumulate over months
Insight-First
The “aha” moment is the point — click any connection to see the insight
Simple and Calm
Designed for busy professionals, not overwhelming academic graphs
How It Works
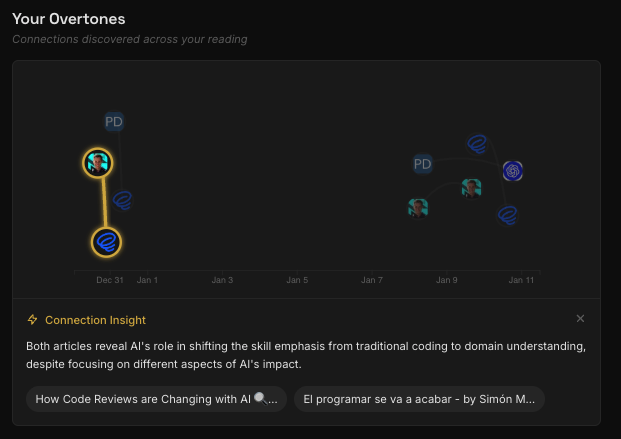
The Visualization
Overtones uses a time-constrained force-directed graph:- X-axis: Time (left = older articles, right = recent)
- Y-axis: Force-directed clustering (connected articles attract each other vertically)
- Nodes: Articles (only those with connections appear)
- Edges: Connections between articles
Interacting with the Graph
Click on a connection (edge):- See the insight explaining why these articles resonate
- View both article titles as clickable links
- Navigate to either article’s detail page
- Highlight that article’s connections (others dim)
- See a preview panel with:
- Article title
- Source domain
- Top tag
- Summary
- Click through to the full article detail
Where Connections Come From
Every connection in Overtones is discovered during your weekly digest generation. Resona analyzes your saved articles and identifies:- Shared themes across different articles
- Complementary concepts that enhance each other
- Patterns that emerge when ideas are viewed together
Connections are only created when meaningful relationships emerge — not every article will have connections, and that’s intentional. Quality over quantity.
Empty State
If you’re new to Resona or haven’t received your first digest yet, Overtones shows a teaser visualization explaining what the graph will look like once connections start appearing. Your first connections will appear after your next weekly digest.Mobile Experience
On mobile devices, Overtones shows a simplified, static snapshot of your graph. The full interactive experience is available on desktop.Frequency
Overtones updates automatically as new connections are discovered. Typically, you’ll see 2-3 new connections per weekly digest, building your constellation of ideas over time. At current rates, users see approximately 150 connections per year — a manageable, meaningful set of insights rather than an overwhelming web.Tips for Exploring
Start with recent connections
Start with recent connections
Connections discovered in recent digests are often the most relevant to your current interests.
Follow the clusters
Follow the clusters
Articles that cluster together vertically share strong thematic connections — explore those groups.
Read the insights
Read the insights
Click connections to read the explanation — these insights often reveal patterns you hadn’t noticed.
Use it with digests
Use it with digests
View a specific digest, then check Overtones to see how its connections fit into your larger knowledge graph.